


This page displays baseline and projected climate data for the hypothetical country, Country “X”.
The projected is based on Shared Socio-economic Pathway (SSP) scenarios. Each scenario presents alternative narratives on how the world might develop over the following years in the absence of climate policy while carrying differing assumptions about human developments, such as population, education, urbanization, economic growth, greenhouse gas (GHG) and aerosol emissions, energy supply and demand, land-use changes.
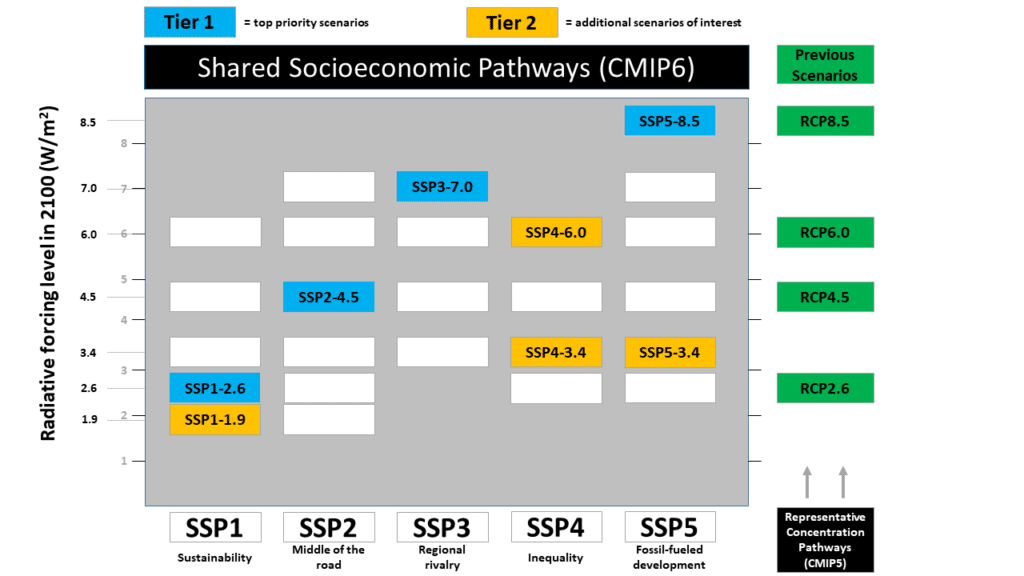
Figure 1. Shared Socio-economic Pathways and year 2100 radiative forcing combinations used in ScenarioMIP (Source: https://climate-scenarios.canada.ca/?page=cmip6-overview-notes).
The climate projection data presented is CMIP6, modeled data from the global climate model compilations derived from the Sixth phase of the Coupled Model Inter-comparison Projects (CMIPs).
The projected data contains the median, and the lower (10th percentile) and upper (90th percentile) values based on a multi-model ensemble, representing the range and distribution of the most plausible projected outcomes of change in the climate system for a selected SSP.
In this risk assessment tool, only SSP2-4.5 and SSP5-8.5 will be used.
Temperature
- Average Daily
- Average Daily Minimum
- Warmest Daily Maximum
- Minimum of Daily-Minimum
- Hot Days
- Tropical Nights
Figure 2. Annual median baseline and projected average daily temperature in Country “X” with the lower (10th percentile) and upper (90th percentile) values displayed.
Figure 3. Annual median baseline and projected average daily minimum temperature in Country “X” with the lower (10th percentile) and upper (90th percentile) values displayed.
Figure 4. Annual median baseline and projected warmest daily maximum temperature in Country “X” with the lower (10th percentile) and upper (90th percentile) values displayed.
Figure 5. Annual median baseline and projected minimum of daily minimum temperature in Country “X” with the lower (10th percentile) and upper (90th percentile) values displayed.
Figure 6. Annual median baseline and projected number of hot days (when temperature exceeds 30°C) in Country “X” with the lower (10th percentile) and upper (90th percentile) values displayed.
Figure 7. Annual median baseline and projected number of hot days (when temperature exceeds 35°C) in Country “X” with the lower (10th percentile) and upper (90th percentile) values displayed.
Figure 8. Annual median baseline and projected number of tropical nights in Country “X” that exceeds 20 °C with the lower (10th percentile) and upper (90th percentile) values displayed.
Figure 9. Annual median baseline and projected number of tropical nights in Country “X” that exceeds 26 °C with the lower (10th percentile) and upper (90th percentile) values displayed.
Precipitation
Figure 10. Annual median baseline and projected annual precipitation in Country “X” with the lower (10th percentile) and upper (90th percentile) values displayed.
Figure 11. Annual median baseline and projected number of days with precipitation greater than 20mm in Country “X” with the lower (10th percentile) and upper (90th percentile) values displayed.
Figure 12. Annual median baseline and projected number of days with precipitation greater than 50mm in Country “X” with the lower (10th percentile) and upper (90th percentile) values displayed.
Figure 13. Annual median baseline and projected average largest 5-day cumulative precipitation (mm) in Country “X” with the lower (10th percentile) and upper (90th percentile) values displayed.
Last updated: November 10, 2023
Temperature
- Average Daily
- Average Daily Minimum
- Warmest Daily Maximum
- Minimum of Daily-Minimum
- Hot Days
- Tropical Nights
Figure 14. Annual median baseline and projected average daily temperature in Country “X” with the lower (10th percentile) and upper (90th percentile) values displayed.
Figure 15. Annual median baseline and projected average daily minimum temperature in Country “X” with the lower (10th percentile) and upper (90th percentile) values displayed.
Figure 16. Annual median baseline and projected warmest daily maximum temperature in Country “X” with the lower (10th percentile) and upper (90th percentile) values displayed.
Figure 17. Annual median baseline and projected minimum of daily minimum temperature in Country “X” with the lower (10th percentile) and upper (90th percentile) values displayed.
Figure 18. Annual median baseline and projected number of hot days (when temperature exceeds 30°C) in Country “X” with the lower (10th percentile) and upper (90th percentile) values displayed.
Figure 19. Annual median baseline and projected number of hot days (when temperature exceeds 35°C) in Country “X” with the lower (10th percentile) and upper (90th percentile) values displayed.
Figure 20. Annual median baseline and projected number of tropical nights in Country “X” that exceeds 20 °C with the lower (10th percentile) and upper (90th percentile) values displayed.
Figure 21. Annual median baseline and projected number of tropical nights in Country “X” that exceeds 26 °C with the lower (10th percentile) and upper (90th percentile) values displayed.
Precipitation
Figure 13. Annual median baseline and projected annual precipitation in Country “X” with the lower (10th percentile) and upper (90th percentile) values displayed.
Figure 23. Annual median baseline and projected number of days with precipitation greater than 20mm in Country “X” with the lower (10th percentile) and upper (90th percentile) values displayed.
Figure 24. Annual median baseline and projected number of days with precipitation greater than 50mm in Country “X” with the lower (10th percentile) and upper (90th percentile) values displayed.
Figure 25. Annual median baseline and projected average largest 5-day cumulative precipitation (mm) in Country “X” with the lower (10th percentile) and upper (90th percentile) values displayed.
Last updated: November 10, 2023